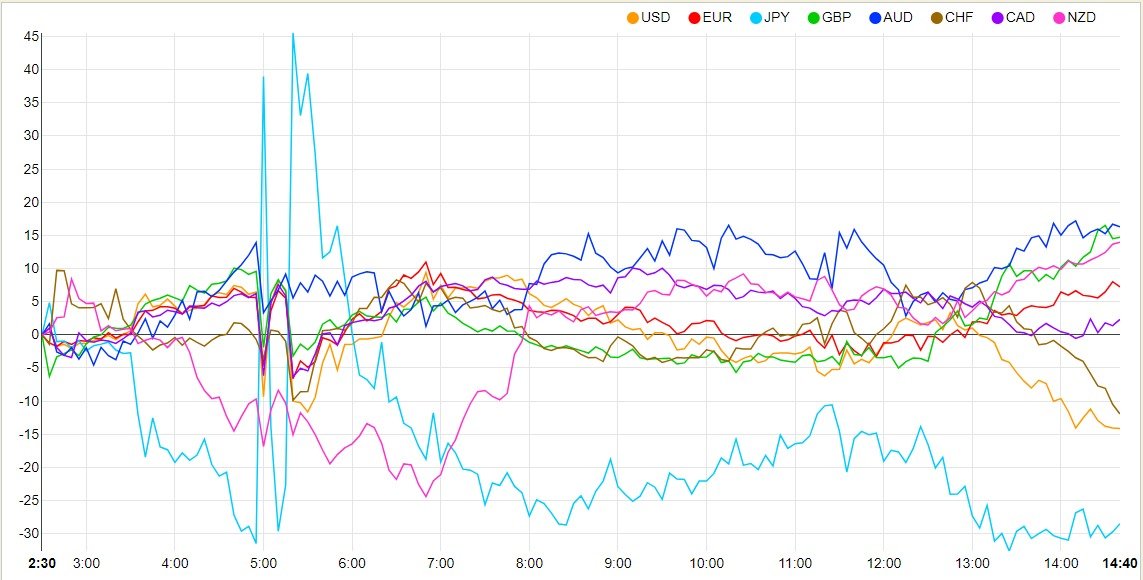
A Currency Strength Chart is a powerful tool for forex traders, providing a visual representation
of the strength of individual currencies. You can explore two key conditions using this chart:
1.Volatility of a Pair
2. Direction of a Pair
A Currency Strength Chart is a visual representation that compares the relative strength or
weakness of different currencies against each other in the foreign exchange (Forex) market. It
provides traders with a quick and clear overview of how individual currencies are performing
relative to others over a specified period.
This is indicated by the distance between the currency lines. Greater distance suggests higher volatility.
Lines Separate: Indicates a specific direction.
Lines Get Closer: Signals an opposite direction.
Lines in Parallel: Suggests no clear direction.
Remember: While the Currency Strength Chart is invaluable, it should not be used in isolation. Integrate it with your own trading strategy for the best results.
To ensure you don’t exhaust your trading capital, follow these guidelines for position sizing:
Limit the loss of any single trade to a maximum of 2% of your account balance.
If you’re a
beginner, restrict losses to 1% of your available balance.
Loss is not solely determined by the number of pips lost. It should be calculated based on your account size and average loss in pips.
Average Loss Formula: Average Loss=Total Loss (in pips) / Number of Lost Trades
For instance, if your average loss is 10 pips, refer to the table below to guide your position
sizing.
Here's a guide to help you determine the appropriate position size for your trades
based on your account balance and risk tolerance.
Account Size | Loss Cut (%) | Loss Cut (Amount) | Position Size |
---|---|---|---|
$1,000 | 1% | $10 | 0.1 lot |
$1,000 | 2% | $20 | 0.2 lot |
$5,000 | 1% | $50 | 0.5 lot |
$5,000 | 2% | $100 | 1.0 lot |
$10,000 | 1% | $100 | 1.0 lot |
$10,000 | 2% | $200 | 2.0 lot |
Formula: Winning rate = Number of winning trades ÷ Total number of trades
Explanation:This metric shows the percentage of your trades that are profitable. A higher winning rate indicates a greater proportion of successful trades.
Formula: PF = Total profit (in pips) ÷ Total loss (in pips)
Explanation:The Profit Factor measures the ratio of total profits to total losses. If the PF is 1, it means you're breaking even. A PF greater than 1 indicates profitability, while a PF less than 1 indicates losses.
Formula: R multiple = Average profit (in pips) ÷ Average loss (in pips)
Explanation:The R multiple compares the average profit per trade to the average loss per trade. A higher R multiple means that your winning trades are significantly larger than your losing trades, contributing to overall profitability.
Entering the forex market without proper profit and account management is as perilous as climbing Mt. Everest without knowing how to tie your lifeline ropes. It's crucial for your trading success, much like your life depends on safety measures while climbing. Always review your recent trading results. Analyze data from at least your last 20 to 100 trades to determine your R multiple and winning percentage.
https://www.forextime.com/trading-tools/trading-calculator/pip-calculator
Sri Radha Towers,
5 Namachivaya
Nagar,
Saravanampatti,
Coimbatore-641035.
info@cloudsedgeacademy.com
+91 88385 54839
© cloudsedgeacademy. All Rights Reserved.
Designed by Cogniitec